
Crimson Feature of the Month: Fundraising Dashboard
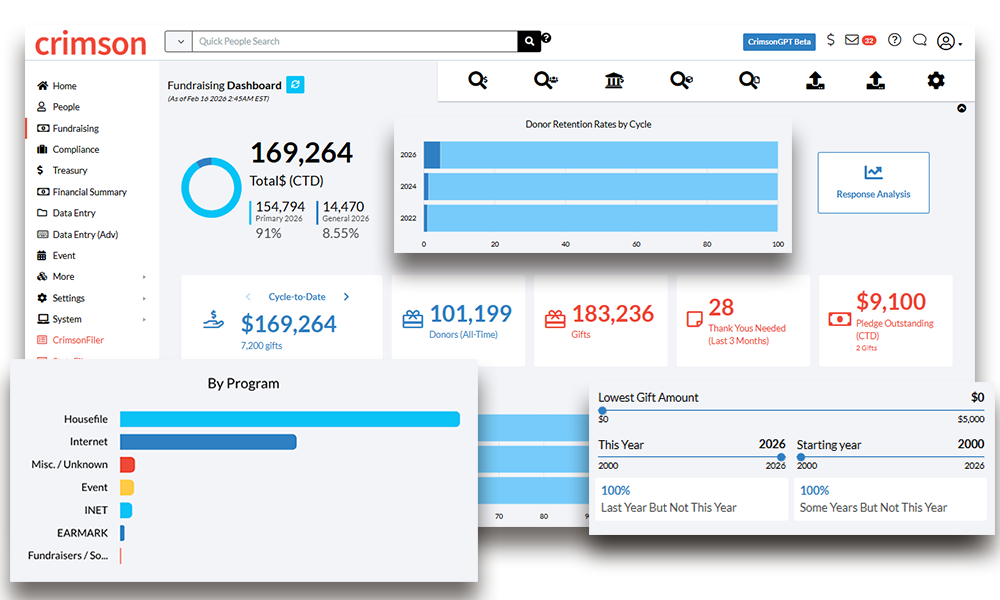
The Crimson Fundraising Dashboard gives you a complete overview of your contribution data in one place. From total gift amounts and fund code breakdowns to your top performing source codes, fundraisers, and locations, this dashboard makes it easy to see exactly where your money is coming from and how your fundraising efforts are performing. Whether you need a quick status check or want to dig into the details behind a specific number, the Fundraising Dashboard puts that information at your fingertips.
Navigate to Key Tools
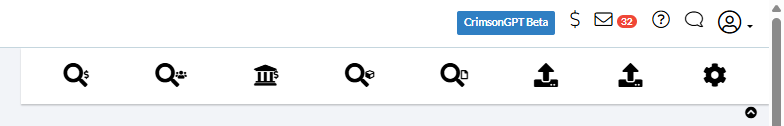
At the top right corner of the Fundraising Dashboard, you'll find the Dashboard Navigation Bar. This gives you quick access to several essential tools, including Money Search, People Search, Settings, and Import tools. Instead of navigating through multiple menus to reach the features you use most, the Navigation Bar keeps them one click away.
Keep Your Dashboard Current
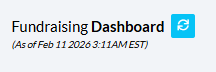
The Fundraising Dashboard updates its totals automatically on a nightly basis. If you've been entering new transactions throughout the day and want the dashboard to reflect your most recent data, click the green "Refresh Fundraising Dashboard" button to the right of the Dashboard title. You'll receive a confirmation message in your Crimson Inbox once the recalculation is complete.
See Your Contribution Totals Immediately
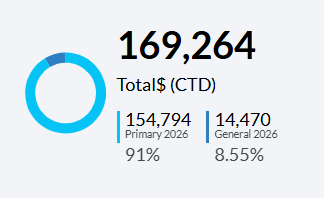
The pie chart in the top left part of the dashboard breaks down your contribution totals by fund code and displays how much has been raised cycle-to-date. When you select a particular fund code in the pie chart, all the totals update to reflect contributions specific to that fund code.
For example, if you're viewing contribution data across all active fund codes and then click on your P2026 (Primary 2026) fund code, the totals will instantly filter to show only what has been raised for that specific fund. This makes it simple to get a focused snapshot of any single fund without running a separate search.
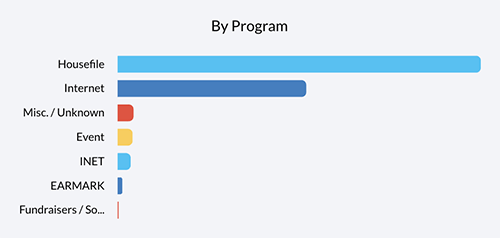
The bar chart on the right breaks down your fundraising by program. When you click on a Program Code, you will get a breakdown of funds raised by that specific program.
Check Your Bluebooks
If you have a direct mail program, click on the Response Analysis button to see how your programs are doing. This feature enables you to independently verify package performance without relying on reports from third-party mail vendors and calculate ROI with up-to-date information.
With Crimson’s Response Analysis feature, you can:
Access one-click analytics to breakdown Packages and Source Codes by programs, clubs, or memberships.
Utilize customizable Flag, Action and Attribute codes to identify donors.
Quickly see how your list segments are performing.
Track response rates over time.
Click Any Card to Drill Down
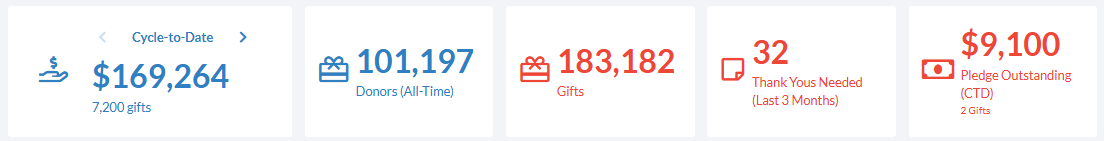
Under the graphs, you’ll see a row of interactive action cards. Click on the information shown on any card to generate a list of the records that make up that count or amount.
On the Cycle-to-Date card, you can click through the Cycle-to-Date card to see Year-to-Date, Quarter-to-Date, Month-to-Date, Week-to-Date, Past 30 Days, and Past 7 Days. On the following cards, you can see the count for Donors (All-Time), Gifts, Thank Yous Needed (Last 3 Months) and Pledge Outstanding (CTD).
Find Donors by Gift Dates
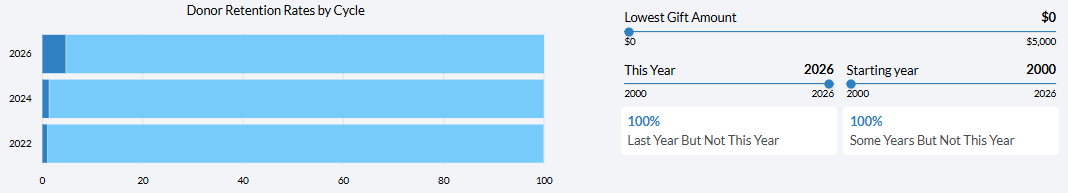
Under the Action Cards, there are two graphs, Donor Retention Rates by Cycle and Last Year But Not This Year/Some Years But Not This Year.
These graphs help you identify donors who have lapsed by the last few years. When you click on the Donor Retention Rates by Cycle bars, you can pull up a list of donors who last gave in 2022, 2024 and 2026.
With the LYBNTY/SYBNTY graph, you can toggle the lowest gift amount and the last year given with the starting year. When you click on the LYBNTY and SYBNTY buttons, a list of donors will open.
Identify Your Top Performers
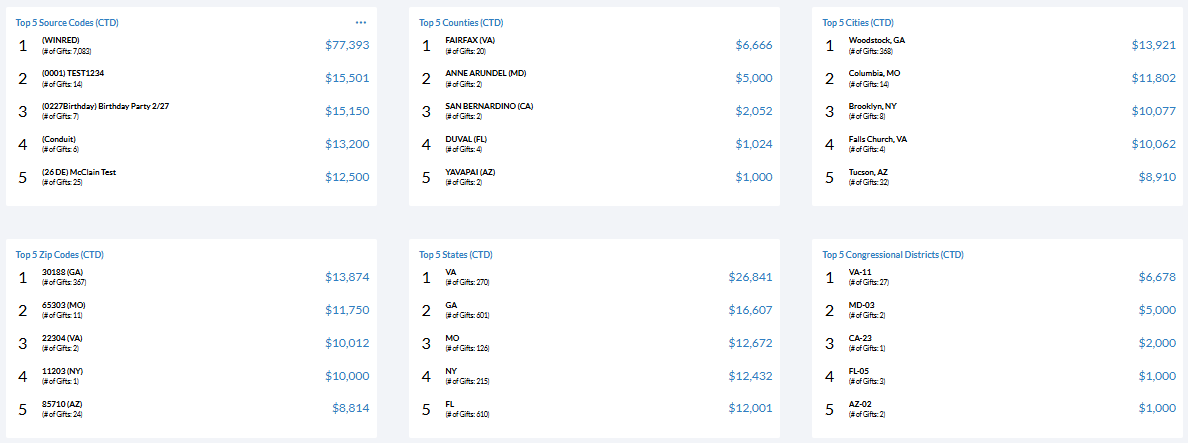
The Top 5 lists provide summary information on your top programs, source codes, fundraisers, and locations. These lists show you exactly how and where you are raising the most donations, so you can quickly identify which programs are driving the most revenue and which fundraisers are leading the way.
This is especially useful for spotting trends, recognizing high-performing efforts, and making informed decisions about where to focus your resources going forward.
Run Income Reports On Demand
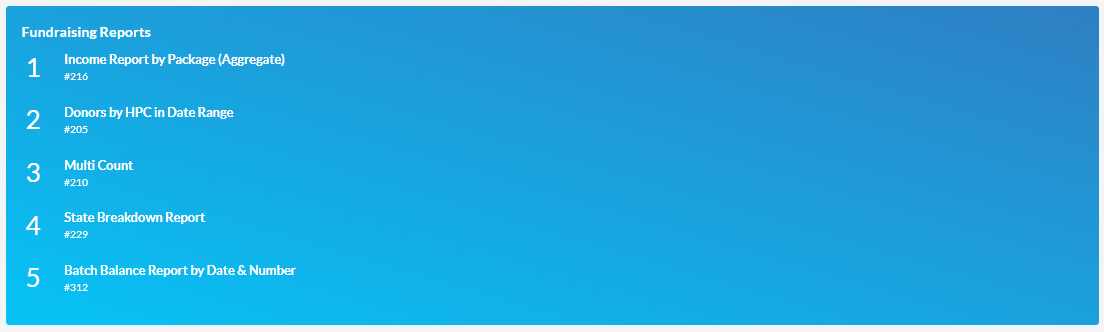
At the very bottom of the Fundraising Dashboard, you'll find a list of Crimson fundraising reports. Click on any report title to run it immediately. If you need to see the full list of available reports, click the menu button to display all of them. These reports give you the ability to pull detailed financial data whenever you need it and without navigating away from the dashboard.
Why the Fundraising Dashboard Matters
Having clear visibility into your fundraising data isn't a luxury. For campaigns and committees managing significant volume, it's a necessity. The Fundraising Dashboard brings together the numbers you need to track performance, spot potential issues early, and make data-driven decisions about your fundraising strategy.
By centralizing your contribution totals, top performer lists, and income reports in a single view, the Fundraising Dashboard helps you spend less time searching for information and more time acting on it.
For more detailed information, visit the Crimson: Fundraising Dashboard guide on our HelpDesk, or contact the Crimson Support Team at CrimsonSupport@cmdi.com.